Ben Pitler
Human rights defender and University of Washington MBA candidate, data science/analytics track. Passionate about using data science to achieve justice.
This portfolio details my use of data science to investigate and document violations of international human rights law. Please direct all questions and requests to collaborate to ds4hrbp@protonmail.com
LinkedIn
Using cartopy to map death sentences in Egypt
Here, I used Python’s cartopy package, along with matplotlib, to map the governorates where more and less preliminary death sentences were handed down between 2011 and 2018:
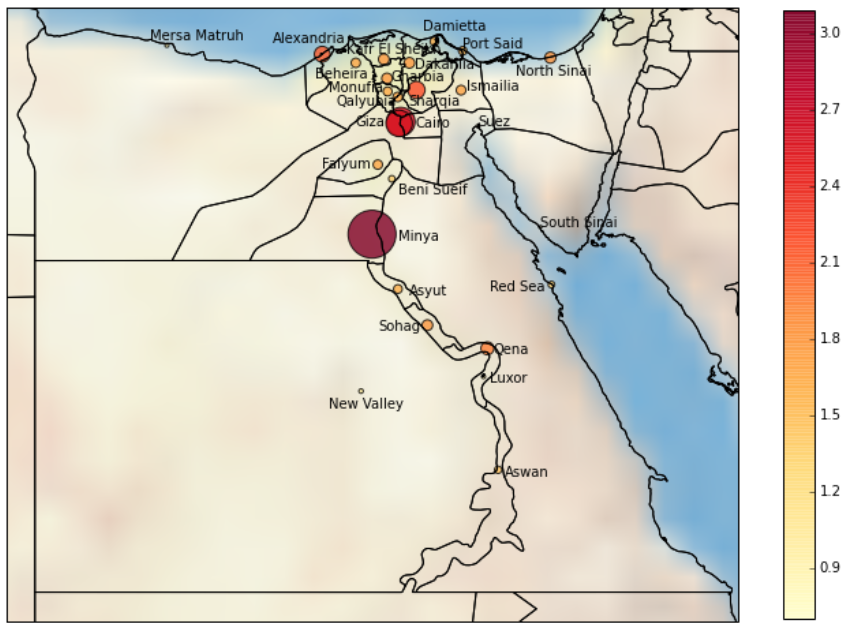
In the governorates where more death sentences occurred, the data points are larger and darker red. The scale here is logarithmic, which allows for better comparison–without a logarithmic scale, some governorates, like Minya, which saw more than 1000 death sentences, would dwarf all others. This viz isn’t perfect–the labels are overlapping and somewhat difficult to read in the Nile Delta area, where governorates are small and close together, and the logarithmic scale leaves the viewer unable to tell exactly how many death sentences occurred in each location. That said, it provides a good summary of where most death sentences were handed down.
The code for this viz looks like this:
[//]: # Import statements
import pandas as pd
import matplotlib.pyplot as plt
plt.style.use('classic')
%matplotlib inline
import numpy as np
import sys
import cartopy.crs as ccrs
import cartopy.feature as cf
import cartopy.io.shapereader as shapereader
import geopandas
sys.path

[//]: # Reading in the data from .csv file. This .csv contains 3000+ rows, each of which contains information on a discrete individual sentenced to death by an Egyptian court between 2011 and 2018
EDPI = pd.read_csv("egypt_individuals_csv.csv", sep=",")

[//]: # Removing rows where date of death sentence is unknown
EDPI = EDPI[EDPI['Longitude of Offence'] != 'Unknown']
EDPI = EDPI[EDPI['Longitude of Offence'] != 'unknown']
EDPI = EDPI[EDPI['Latitude of Offence'] != 'Unknown']
EDPI = EDPI[EDPI['Latitude of Offence'] != 'unknown']

[//]: # Converting latitude and longitude to float types
EDPI['Latitude of Offence'] = EDPI['Latitude of Offence'].astype(float)
EDPI['Longitude of Offence'] = EDPI['Longitude of Offence'].astype(float)

[//]: # Creating new data frame grouped by governorate, latitude, and longitude, counting the number of death sentences in each location
EDPI_map_df = EDPI.groupby( [ 'Governorate of offence', 'Latitude of Offence', 'Longitude of Offence'] ).size().to_frame(name = 'count').reset_index()

[//]: # Defining parameters for the plot
lat, lon = EDPI_map_df['Latitude of Offence'], EDPI_map_df['Longitude of Offence']
count = EDPI_map_df['count']
gov = EDPI_map_df['Governorate of offence']


[//]: # Plotting the map using cartopy and matplotlib
fig = plt.figure(figsize=(12,12))
ax = fig.add_subplot(1,1,1, projection=ccrs.PlateCarree())
ax.stock_img()
ax.coastlines()
ax.add_feature(cfeature.STATES)
ax.set_extent([24.5, 37, 21.5, 32],
              crs=ccrs.PlateCarree()) ## Important

plt.scatter(x=lon, y=lat,
            cmap="YlOrRd",
            c=np.log10(count),
            s=count,
            alpha=0.8,
            edgecolors = "black",
            transform=ccrs.PlateCarree()) ## Important

[//]: # Creating and adjusting the location of labels for the data points. I did this initially with a for loop, but the labels were too crowded, so I ended up doing this part manually
plt.annotate("Alexandria", (lon[0]-.85, lat[0]+.2))
plt.annotate("Aswan", (lon[1]+.1, lat[1]-.1))
plt.annotate("Asyut", (lon[2]+.2, lat[2]-.1))
plt.annotate("Beheira", (lon[3]-.7, lat[3]-.25))
plt.annotate("Beni Sueif", (lon[4]+.1, lat[4]-.25))
plt.annotate("Cairo", (lon[5]+.25, lat[5]-.1))
plt.annotate("Dakahlia", (lon[6]+.1, lat[6]-.1))
plt.annotate("Damietta", (lon[7]-.2, lat[7]+.19))
plt.annotate("Faiyum", (lon[8]-.95, lat[8]-.05))
plt.annotate("Gharbia", (lon[9]+.07, lat[9]-.05))
plt.annotate("Giza", (lon[10]-.75, lat[10]-.05))
plt.annotate("Ismailia", (lon[11]+.1, lat[11]))
plt.annotate("Kafr El Sheikh", (lon[12]-.65, lat[12]+.1))
plt.annotate("Luxor", (lon[13]+.1, lat[13]-.1))
plt.annotate("Mersa Matruh", (lon[14]-.3, lat[14]+.1))
plt.annotate("Minya", (lon[15]+.45, lat[15]-.1))
plt.annotate("Monufia", (lon[16]-1, lat[16]))
plt.annotate("New Valley", (lon[17]-.55, lat[17]-.3))
plt.annotate("North Sinai", (lon[18]-.6, lat[18]-.3))
plt.annotate("Port Said", (lon[19], lat[19]+.05))
plt.annotate("Qalyubia", (lon[20]-1.05, lat[20]-.15))
plt.annotate("Qena", (lon[21]+.1, lat[21]-.1))
plt.annotate("Red Sea", (lon[22]-1.05, lat[22]-.1))
plt.annotate("Sharqia", (lon[23]-.15, lat[23]-.25))
plt.annotate("Sohag", (lon[24]-.85, lat[24]-.1))
plt.annotate("South Sinai", (lon[25], lat[25]))
plt.annotate("Suez", (lon[26], lat[26]))


[//]: # Creating colorbar and adjusting size
plt.colorbar(shrink=0.667)
plt.show()